The most expensive bug in 2026 isn’t a memory leak. It’s a Reasoning Loop.
Imagine this scenario: You deploy a “Support Agent” to production. Its goal is to reset a user’s password. It encounters an unexpected API error. Instead of failing gracefully, the LLM decides to “retry with different parameters.” It retries. And retries. And retries.
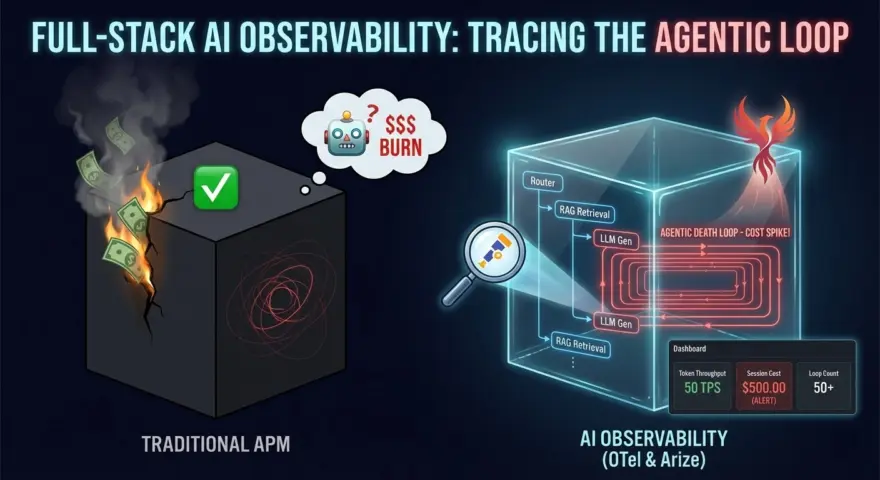
Because the API returns a 200 OK (with an error message in the body), your traditional APM tools (Datadog, New Relic) show green lights.
Meanwhile, your agent is spinning at 50 tokens per second. By the time you check the dashboard 10 minutes later, that single session has burned $500 in GPT-5 compute credits.
In the Agentic Era, CPU metrics are irrelevant. You need Cognitive Observability. You need to trace the thought process, not just the HTTP requests.
This guide details how to implement Full-Stack AI Observability using OpenTelemetry (OTel) and Arize Phoenix to detect, diagnose, and kill zombie agents before they bankrupt you.
The Blind Spot: Why Standard APM Fails
Traditional tracing (Jaeger, Zipkin) was built for deterministic microservices. Service A calls Service B.
Agents are non-deterministic loops.
- The Span Problem: An agentic “run” isn’t a single request; it’s a graph of 50+ LLM calls, tool executions, and vector searches.
- The Payload Problem: Knowing that a call happened is useless. You need to know what the agent was thinking. Did it hallucinate a tool parameter? Did it misinterpret the observation?
- The Cost Problem: In microservices, cost is fixed (server time). In AI, cost is variable (token count). You need to attribute every fraction of a cent to a specific Tenant ID or User ID.
The Architecture: OpenInference & OTel
We don’t need to reinvent the wheel. We use OpenTelemetry, but we adopt the OpenInference semantic conventions—the 2026 standard for tracing LLM applications.
The Stack
- Instrumentation: Python OpenTelemetry SDK +
openinference-instrumentation-langchain. - Collector: The OTel Collector (running as a sidecar).
- Backend: Arize Phoenix (for trace visualization and evaluation) or Grafana Tempo (for long-term storage).
The Blueprint: 10 Elite Configurations & Code Snippets
Below is the production-ready configuration to instrument a LangGraph agent. This setup captures inputs, outputs, tool calls, and—crucially—token costs per step.
1. The OTel Tracer Provider Setup (The Foundation)
Configure the Global Tracer to export data to Arize (local or cloud).
from opentelemetry import trace
from opentelemetry.sdk.trace import TracerProvider
from opentelemetry.sdk.trace.export import BatchSpanProcessor
from opentelemetry.exporter.otlp.proto.grpc.trace_exporter import OTLPSpanExporter
from openinference.instrumentation.langchain import LangChainInstrumentor

# 1. Initialize the Tracer Provider
tracer_provider = TracerProvider()
trace.set_tracer_provider(tracer_provider)

# 2. Configure the Exporter (Targeting Arize Phoenix local instance)
otlp_exporter = OTLPSpanExporter(endpoint="http://localhost:4317", insecure=True)
span_processor = BatchSpanProcessor(otlp_exporter)
tracer_provider.add_span_processor(span_processor)

# 3. Auto-Instrument LangChain / LangGraph
# This magically captures every "Node" execution as a Span
LangChainInstrumentor().instrument(tracer_provider=tracer_provider)
2. The “Tenant-Aware” Context Propagation
How to tag a trace with a specific User ID or Tenant ID for cost attribution.
from opentelemetry import trace

tracer = trace.get_tracer(__name__)

def run_agent_for_user(user_query: str, tenant_id: str, user_id: str):
    # Start a root span for the entire interaction
    with tracer.start_as_current_span("agent_execution") as span:
        # Set attributes that will cascade down to all child spans (LLM calls, DB lookups)
        span.set_attribute("user.id", user_id)
        span.set_attribute("tenant.id", tenant_id)
        span.set_attribute("project.environment", "production")

        # Now invoke your LangGraph agent
        # The instrumentor will automatically attach these attributes to the LLM calls
        agent_graph.invoke({"messages": [user_query]})
3. The “Token Bleed” Detector (Cost Tracking)
A custom Span Processor that calculates cost in real-time based on model names.
# Pseudo-code for a Cost Processor logic
MODEL_COSTS = {
    "gpt-4o-2024-05-13": {"input": 5.00, "output": 15.00}, # $ per 1M tokens
    "claude-3-5-sonnet": {"input": 3.00, "output": 15.00}
}

def calculate_cost(span):
    model = span.attributes.get("llm.model_name")
    input_tokens = span.attributes.get("llm.token_count.prompt")
    output_tokens = span.attributes.get("llm.token_count.completion")

    if model in MODEL_COSTS:
        cost = (input_tokens / 1e6 * MODEL_COSTS[model]['input']) + \
               (output_tokens / 1e6 * MODEL_COSTS[model]['output'])
        span.set_attribute("llm.cost.usd", cost)
4. The “Infinite Loop” Circuit Breaker
Don’t just observe the loop; kill it. This logic checks trace depth.
# Inside your LangGraph Node
def reasoning_node(state):
    # Check recursion depth from state
    current_depth = len(state['messages'])

    if current_depth > 20:
        # Emergency Halt
        # Log a "Critical Event" span to OTel
        with tracer.start_as_current_span("emergency_halt") as span:
            span.set_attribute("error", True)
            span.set_attribute("reason", "Max recursion depth exceeded")

        return {"messages": [SystemMessage(content="ERROR: Agent stuck in loop. Terminating.")]}

    # Continue normal logic...
5. Masking PII in Traces (GDPR Compliance)
Never log raw prompts if they contain PII. Use a custom hook to redact sensitive data before it leaves the app.
from openinference.instrumentation import SafeLogger

class PIIRedactor:
    def redact(self, text):
        # Regex for emails, SSNs, Credit Cards
        return re.sub(r'\b[\w\.-]+@[\w\.-]+\.\w{2,4}\b', '[EMAIL_REDACTED]', text)

# Configure the instrumentor to use the redactor
LangChainInstrumentor().instrument(
    tracer_provider=tracer_provider,
    response_hook=lambda span, response: span.set_attribute("output", PIIRedactor().redact(response))
)
6. Tracing Tool Execution (The “Action” Layer)
Visualize exactly what arguments the agent passed to your API.
# Decorate your tools to ensure they show up in the trace visualization
from langchain.tools import tool

@tool
def query_sql_database(query: str):
    """Executes a SQL query."""
    # The 'tool' decorator + OTel auto-instrumentation captures:
    # 1. The input 'query'
    # 2. The execution time
    # 3. The resulting rows (or error)
    return db.run(query)
7. The “Hallucination Rate” Metric
Use Arize’s evaluation library to grade traces asynchronously.
from phoenix.evals import HallucinationEvaluator, run_evals
import pandas as pd

# Pull traces from the last hour
dataframe = phoenix_client.get_spans_dataframe(filter="span_kind == 'LLM'")

# Run the Hallucination Evaluator (uses a small LLM to judge the big LLM)
eval_results = run_evals(
    evaluators=[HallucinationEvaluator(model="gpt-4-turbo")],
    dataframe=dataframe,
    provide_explanation=True
)

# If hallucination rate > 10%, trigger PagerDuty
if eval_results['hallucination_score'].mean() > 0.1:
    alert_devops_team()
8. Distributed Tracing ID Injection (Meta-Prompting)
Inject the Trace ID into the System Prompt so the LLM “knows” its own debug ID.
trace_id = trace.get_current_span().get_span_context().trace_id

system_prompt = f"""
You are a helpful assistant.
DEBUG_TRACE_ID: {trace_id}
If you encounter a fatal error, output this Trace ID to the user.
"""
9. Latency Bucketing by Step Type
Differentiate between “Thinking Time” (LLM Generation) and “Acting Time” (Tool Latency).
# Arize / Prometheus Query
sum(rate(span_duration_seconds_sum{span_kind="LLM"}[5m]))
vs
sum(rate(span_duration_seconds_sum{span_kind="TOOL"}[5m]))

# Insight: If Tool Latency spikes, it's your DB. If LLM Latency spikes, it's OpenAI.
10. The Trace Sampling Policy
Don’t trace everything in production. It slows you down.
# Configure Head-Based Sampling
from opentelemetry.sdk.trace.sampling import ParentBased, TraceIdRatioBased

# Trace 10% of requests, but ALWAYS trace requests that have errors
sampler = ParentBased(root=TraceIdRatioBased(0.1))

tracer_provider = TracerProvider(sampler=sampler)
Best Practices for 2026 Implementation
1. The “Golden Signals” of AI
Forget CPU/RAM. Your dashboard should show:
- Token Throughput (TPS): Tokens per second.
- Cost per Session: The most critical business metric.
- Loop Count: Average number of turns per session. If this spikes, your prompts are broken.
- Feedback Score: User 👍/👎 ratio linked to specific Trace IDs.
2. Don’t Debug in Production Strings
Stop using print(response). It is unscalable and insecure. Use the Trace Waterfall view in Arize. It allows you to expand a single chat session and see the exact sequence:
User Query -> Router -> RAG Retrieval -> Context Stuffing -> LLM Gen -> Tool Call -> Final Answer.
3. Alert on “Cost Velocity”
Set an alert: “If any single Trace ID consumes > $2.00, kill the connection.”
This is your insurance policy against a recursive loop bug draining your wallet overnight.
From “Black Box” to “Glass Box”
If you cannot trace it, you cannot trust it.
Building autonomous agents without OTel is like flying a plane with the windows painted black. You might be moving fast, but you have no idea if you are heading toward the destination or a mountain.
Install arize-phoenix locally today (pip install arize-phoenix). Run the Trace Provider Setup (Config #1) on your dev machine. Seeing your agent’s “thought process” visualized as a timeline for the first time is a revelation.